Profile: Piping Engineer
Designation Manager
Location Delhi NCR
Qualification: BE / B. Tech (Mechanical)
Industry Oil and Gas/ Power/Infrastructure/Energy
Experience: 8 -15 Years
Salary: Best In the Industry.
Knowledge, Skills & Abilities:
• Approximately 8-15 Tears of Experience in Oil & Gas or Power Sector In Piping / Pipeline Design
• Good Analytical & Problem Solving Skill
• Proven Ability To Develop & manage The Team Of Engineers
• Should Be Conservant With National & International Codes & Standards
Key Responsibilities:
• Development of Plot Plan
• Development of P & ID
• Piping Material Specifications
• Material Take off & Purchase Specifications
• Piping General Arrangement Drawings
• Isometrics & Design of Pipe Supports
• Tender Specifications
• Equipment Layout & Elevations
• Piping Routing Study
• Nozzle Orientation & Platform Details
• Smart Plant Design Review (SPR)
• Review of Piping Isometrics & Piping GAD’s
• Material Take off & Estimation
• Pipe Support Designs
• Civil Loading Data for Pipe Racks.
Knowledge of PDS modelling will be an added advantage
The updated profile should include the following:
Current Company
Current Location
Current Designation
Current CTC
Expected CTC
Total Experience
Notice Period
Highest Qualification
It would be my pleasure to hear from you.
With best regards,
Anushree
9311258007
Email- super18@superconsultancy.com
you may also like: MOST READ
Tuesday, April 26, 2011
Plant Design System
Plant Design System is software provided by Intergraph Corporation for laying out and designing industrial plants such as oil refineries, power stations, mine processing plants, smelters, offshore platforms, FPSO's and more. PDS is mainly used as enterprise software.[1]
Explained simply, using this software one can create a 3D model of a plant for visualisation of the proposed plant. Processes can be used that check to see if there are any clashes in that model. From the model one can also extract a complete listing of all the components that need to be purchased for that plant. Lengths of pipes, numbers of flanges, numbers of columns and their sizes etc. You can also extract many of the plans and drawings that are required to build that plant.
PDS and other competitive solutions such as PDMS were developed in the 70's and 80's. They are still reliable solutions but some companies are switching to other software solutions such as Intergraph's SmartPlant 3D.
Some of the modules that PDS covers are as follows.
you may also like: MOST READ
Explained simply, using this software one can create a 3D model of a plant for visualisation of the proposed plant. Processes can be used that check to see if there are any clashes in that model. From the model one can also extract a complete listing of all the components that need to be purchased for that plant. Lengths of pipes, numbers of flanges, numbers of columns and their sizes etc. You can also extract many of the plans and drawings that are required to build that plant.
PDS and other competitive solutions such as PDMS were developed in the 70's and 80's. They are still reliable solutions but some companies are switching to other software solutions such as Intergraph's SmartPlant 3D.
Some of the modules that PDS covers are as follows.
- 1) PDS 3D Theory
- 2) MicroStation for PDS-3D
- 3) Creating Equipment Models with PDS-3D
- 4) Extracting Orthographic Drawings with PDS-3D
- 5) Creating Piping Models with PDS-3D
- 6) Clash Detection
- 7) Spec Writing for PDS- 3D
- 8) Writing Reports using PDS-3D
- 9) Electrical Raceway Modeling
- 10) HVAC - Heating Ventilation and Air Conditioning
you may also like: MOST READ
Geographic information system
A geographic information system (GIS), geographical information system, or geospatial information system is a system that captures, stores, analyzes, manages and presents data with reference to geographic location data. In the simplest terms, GIS is the merging of cartography, statistical analysis and database technology. GIS may be used in archaeology, geography, cartography, remote sensing, land surveying, public utility management, natural resource management, precision agriculture, photogrammetry, urban planning, emergency management, landscape architecture, navigation, aerial video and localized search engines.
A GIS can be thought of as a system - it digitally creates and "manipulates" spatial areas that may be jurisdictional, purpose or application-oriented for which a specific GIS is developed. Hence, a GIS developed for an application, jurisdiction, enterprise or purpose may not be necessarily interoperable or compatible with a GIS that has been developed for some other application, jurisdiction, enterprise, or purpose. What goes beyond a GIS is a spatial data infrastructure (SDI), a concept that has no such restrictive boundaries.
Therefore, in a general sense, the term describes any information system that integrates, stores, edits, analyzes, shares and displays geographic information for informing decision making. GIS applications are tools that allow users to create interactive queries (user-created searches), analyze spatial information, edit data, maps, and present the results of all these operations.[1] Geographic information science is the science underlying the geographic concepts, applications and systems.

 E. W. Gilbert's version (1958) of John Snow's 1855 map of the Soho cholera outbreak showing the clusters of cholera cases in the London epidemic of 1854While the basic elements of topography and theme existed previously in cartography, the John Snow map was unique, using cartographic methods not only to depict but also to analyze clusters of geographically-dependent phenomena for the first time.
The early 20th century saw the development of photozincography, which allowed maps to be split into layers, for example one layer for vegetation and another for water. This was particularly used for printing contours - drawing these was a labour intensive task but having them on a separate layer meant they could be worked on without the other layers to confuse the draughtsman. This work was originally drawn on glass plates but later, plastic film was introduced, being lighter, using less storage space and being less brittle were several of its advantages over glass plates. When all the layers were finished, they were combined into one image using a large process camera. Once colour printing came in, the layers idea was also used for creating separate printing plates for each colour. While the use of layers much later became one of the main typical features of a contemporary GIS, the photographic process just described is not considered to be a GIS in itself - as the maps were just images with no database to link them to.
Computer hardware development spurred by nuclear weapon research led to general-purpose computer 'mapping' applications by the early 1960s.[4]
The year 1960 saw the development of the world's first true operational GIS in Ottawa, Ontario, Canada by the federal Department of Forestry and Rural Development. Developed by Dr. Roger Tomlinson, it was called the Canada Geographic Information System (CGIS) and was used to store, analyze, and manipulate data collected for the Canada Land Inventory (CLI) – an effort to determine the land capability for rural Canada by mapping information about soils, agriculture, recreation, wildlife, waterfowl, forestry and land use at a scale of 1:50,000. A rating classification factor was also added to permit analysis.
CGIS was an improvement over 'computer mapping' applications as it provided capabilities for overlay, measurement and digitizing/scanning. It supported a national coordinate system that spanned the continent, coded lines as arcs having a true embedded topology and it stored the attribute and locational information in separate files. As a result of this, Tomlinson has become known as the 'father of GIS', particularly for his use of overlays in promoting the spatial analysis of convergent geographic data.[5]
CGIS lasted into the 1990s and built a large digital land resource database in Canada. It was developed as a mainframe-based system in support of federal and provincial resource planning and management. Its strength was continent-wide analysis of complex datasets. The CGIS was never available in a commercial form.
In 1964, Howard T. Fisher formed the Laboratory for Computer Graphics and Spatial Analysis at the Harvard Graduate School of Design (LCGSA 1965-1991), where a number of important theoretical concepts in spatial data handling were developed, and which by the 1970s had distributed seminal software code and systems, such as 'SYMAP', 'GRID' and 'ODYSSEY' - that served as sources for subsequent commercial development — to universities, research centers and corporations worldwide.[6]
By the early 1980s, M&S Computing (later Intergraph), Environmental Systems Research Institute (ESRI), CARIS (Computer Aided Resource Information System) and ERDAS emerged as commercial vendors of GIS software, successfully incorporating many of the CGIS features, combining the first generation approach to separation of spatial and attribute information with a second generation approach to organizing attribute data into database structures. In parallel, the development of two public domain systems began in the late 1970s and early 1980s.[7]
The Map Overlay and Statistical System (MOSS) project started in 1977 in Fort Collins, Colorado under the auspices of the Western Energy and Land Use Team (WELUT) and the US Fish and Wildlife Service. GRASS GIS was introduced in 1982 by the US Army Corps of Engineering Research Laboratory (USA-CERL) in Champaign, Illinois, a branch of the US Army Corps of Engineers to meet the need of the US military for software for land management and environmental planning.
In the later 1980s and 1990s, industry growth was spurred on by the growing use of GIS on Unix workstations and the personal computer. By the end of the 20th century, the rapid growth in various systems had been consolidated and standardized on relatively few platforms and users were beginning to explore the concept of viewing GIS data over the Internet, requiring data format and transfer standards. More recently, a growing number of free, open-source GIS packages run on a range of operating systems and can be customized to perform specific tasks. Increasingly geospatial data and mapping applications are being made available via the world wide web.[8]
Several authoritative books on the history of GIS have been published.[9][10]
Any variable that can be located spatially, and increasingly also temporally, can be referenced using a GIS. Locations or extents in Earth space-time may be recorded as dates/times of occurrence, and x, y, and z coordinates representing, longitude, latitude, and elevation, respectively. These GIS coordinates may represent other quantified systems of temporo-spatial reference (for example, film frame number, stream gage station, highway mile marker, surveyor benchmark, building address, street intersection, entrance gate, water depth sounding, POS or CAD drawing origin/units). Units applied to recorded temporal-spatial data can vary widely (even when using exactly the same data, see map projections), but all Earth-based spatial-temporal location and extent references should, ideally, be relatable to one another and ultimately to a "real" physical location or extent in space-time.
Related by accurate spatial information, an incredible variety of real-world and projected past or future data can be analyzed, interpreted and represented to facilitate education and decision making.[11] This key characteristic of GIS has begun to open new avenues of scientific inquiry into behaviors and patterns of previously considered unrelated real-world information.
In developing a Digital Topographic Data Base for a GIS, topographical maps are the main source of data. Aerial photography and satellite images are extra sources for collecting data and identifying attributes which can be mapped in layers over a location facsimile of scale. The scale of a map and geographical rendering area representation type are very important aspects since the information content depends mainly on the scale set and resulting locatability of the map's representations. In order to digitize a map, the map has to be checked within theoretical dimensions, then scanned into a raster format, and resulting raster data has to be given a theoretical dimension by a rubber sheeting/warping technology process.
Uncertainty is a significant problem in designing a GIS because spatial data tend to be used for purposes for which they were never intended. Some maps were made many decades ago, where at that time the computer industry was not even in its perspective establishments. This has led to historical reference maps without common norms. Map accuracy is a relative issue of minor importance in cartography. All maps are established for communication ends. Maps use a historically constrained technology of pen and paper to communicate a view of the world to their users. Cartographers feel little need to communicate information based on accuracy, for when the same map is digitized and input into a GIS, the mode of use often changes. The new uses extend well beyond a determined domain for which the original map was intended and designed.
A quantitative analysis of maps brings accuracy issues into focus. The electronic and other equipment used to make measurements for GIS is far more precise than the machines of conventional map analysis.[14] [Retrieved USGS]. The truth is that all geographical data are inherently inaccurate, and these inaccuracies will propagate through GIS operations in ways that are difficult to predict, yet have goals of conveyance in mind for original design. Accuracy Standards for 1:24000 Scales Map: 1:24,000 ± 40.00 feet
This means that when we see a point or attribute on a map, its "probable" location is within a +/- 40 foot area of its rendered reference, according to area representations and scale.
A GIS can also convert existing digital information, which may not yet be in map form, into forms it can recognize, employ for its data analysis processes, and use in forming mapping output. For example, digital satellite images generated through remote sensing can be analyzed to produce a map-like layer of digital information about vegetative covers on land locations. Another fairly recently developed resource for naming GIS location objects is the Getty Thesaurus of Geographic Names (GTGN), which is a structured vocabulary containing about 1,000,000 names and other information about places.[15]
Likewise, researched census or hydrological tabular data can be displayed in map-like form, serving as layers of thematic information for forming a GIS map.
 Raster data type consists of rows and columns of cells, with each cell storing a single value. Raster data can be images (raster images) with each pixel (or cell) containing a color value. Additional values recorded for each cell may be a discrete value, such as land use, a continuous value, such as temperature, or a null value if no data is available. While a raster cell stores a single value, it can be extended by using raster bands to represent RGB (red, green, blue) colors, colormaps (a mapping between a thematic code and RGB value), or an extended attribute table with one row for each unique cell value. The resolution of the raster data set is its cell width in ground units.
Raster data is stored in various formats; from a standard file-based structure of TIF, JPEG, etc. to binary large object (BLOB) data stored directly in a relational database management system (RDBMS) similar to other vector-based feature classes. Database storage, when properly indexed, typically allows for quicker retrieval of the raster data but can require storage of millions of significantly sized records.
Vector features can be made to respect spatial integrity through the application of topology rules such as 'polygons must not overlap'. Vector data can also be used to represent continuously varying phenomena. Contour lines and triangulated irregular networks (TIN) are used to represent elevation or other continuously changing values. TINs record values at point locations, which are connected by lines to form an irregular mesh of triangles. The face of the triangles represent the terrain surface.
Software is currently being developed to support spatial and non-spatial decision-making, with the solutions to spatial problems being integrated with solutions to non-spatial problems. The end result with these Flexible Spatial Decision-Making Support Systems (FSDSS)[16] is expected to be that non-experts will be able to use GIS, along with spatial criteria, and simply integrate their non-spatial criteria to view solutions to multi-criteria problems. This system is intended to assist decision-making.
 Example of hardware for mapping (GPS and laser rangefinder) and data collection (rugged computer). Field GIS are current trend, accurate mapping and data analysis are done directly in the field. Presented hardware (Field-Map technology) is used mainly for forest inventories, monitoring and mapping.Data capture—entering information into the system—consumes much of the time of GIS practitioners. There are a variety of methods used to enter data into a GIS where it is stored in a digital format.
Existing data printed on paper or PET film maps can be digitized or scanned to produce digital data. A digitizer produces vector data as an operator traces points, lines, and polygon boundaries from a map. Scanning a map results in raster data that could be further processed to produce vector data.
Survey data can be directly entered into a GIS from digital data collection systems on survey instruments using a technique called Coordinate Geometry (COGO). Positions from a Global Navigation Satellite System (GNSS) like Global Positioning System (GPS), another survey tool, can also be directly entered into a GIS. Current trend is data collection and field mapping carried out directly with field computers (position from GPS and/or laser rangefinder). New technologies allow to create maps as well as analysis directly in the field, projects are more efficient and mapping is more accurate.
Remotely sensed data also plays an important role in data collection and consist of sensors attached to a platform. Sensors include cameras, digital scanners and LIDAR, while platforms usually consist of aircraft and satellites.
The majority of digital data currently comes from photo interpretation of aerial photographs. Soft copy workstations are used to digitize features directly from stereo pairs of digital photographs. These systems allow data to be captured in two and three dimensions, with elevations measured directly from a stereo pair using principles of photogrammetry. Currently, analog aerial photos are scanned before being entered into a soft copy system, but as high quality digital cameras become cheaper this step will be skipped.
Satellite remote sensing provides another important source of spatial data. Here satellites use different sensor packages to passively measure the reflectance from parts of the electromagnetic spectrum or radio waves that were sent out from an active sensor such as radar. Remote sensing collects raster data that can be further processed using different bands to identify objects and classes of interest, such as land cover.
When data is captured, the user should consider if the data should be captured with either a relative accuracy or absolute accuracy, since this could not only influence how information will be interpreted but also the cost of data capture.
In addition to collecting and entering spatial data, attribute data is also entered into a GIS. For vector data, this includes additional information about the objects represented in the system.
After entering data into a GIS, the data usually requires editing, to remove errors, or further processing. For vector data it must be made "topologically correct" before it can be used for some advanced analysis. For example, in a road network, lines must connect with nodes at an intersection. Errors such as undershoots and overshoots must also be removed. For scanned maps, blemishes on the source map may need to be removed from the resulting raster. For example, a fleck of dirt might connect two lines that should not be connected.
More advanced data processing can occur with image processing, a technique developed in the late 1960s by NASA and the private sector to provide contrast enhancement, false colour rendering and a variety of other techniques including use of two dimensional Fourier transforms.
Since digital data is collected and stored in various ways, the two data sources may not be entirely compatible. So a GIS must be able to convert geographic data from one structure to another.
The earth can be represented by various models, each of which may provide a different set of coordinates (e.g., latitude, longitude, elevation) for any given point on the Earth's surface. The simplest model is to assume the earth is a perfect sphere. As more measurements of the earth have accumulated, the models of the earth have become more sophisticated and more accurate. In fact, there are models that apply to different areas of the earth to provide increased accuracy (e.g., North American Datum, 1927 - NAD27 - works well in North America, but not in Europe). See datum (geodesy) for more information.
Projection is a fundamental component of map making. A projection is a mathematical means of transferring information from a model of the Earth, which represents a three-dimensional curved surface, to a two-dimensional medium—paper or a computer screen. Different projections are used for different types of maps because each projection particularly suits specific uses. For example, a projection that accurately represents the shapes of the continents will distort their relative sizes. See Map projection for more information.
Since much of the information in a GIS comes from existing maps, a GIS uses the processing power of the computer to transform digital information, gathered from sources with different projections and/or different coordinate systems, to a common projection and coordinate system. For images, this process is called rectification.
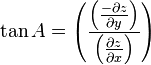
The elevation at a point will have perpendicular tangents (slope) passing through the point, in an east-west and north-south direction. These two tangents give two components, ∂z/∂x and ∂z/∂y, which then be used to determine the overall direction of slope, and the aspect of the slope. The gradient is defined as a vector quantity with components equal to the partial derivatives of the surface in the x and y directions.[23]
The calculation of the overall 3x3 grid slope and aspect for methods that determine east-west and north-south component use the following formulas respectively:

Zhou and Liu[21] describe another algorithm for calculating aspect, as follows:

Such a map can be thought of as a rainfall contour map. Many sophisticated methods can estimate the characteristics of surfaces from a limited number of point measurements. A two-dimensional contour map created from the surface modeling of rainfall point measurements may be overlaid and analyzed with any other map in a GIS covering the same area.
Additionally, from a series of three-dimensional points, or digital elevation model, isopleth lines representing elevation contours can be generated, along with slope analysis, shaded relief, and other elevation products. Watersheds can be easily defined for any given reach, by computing all of the areas contiguous and uphill from any given point of interest. Similarly, an expected thalweg of where surface water would want to travel in intermittent and permanent streams can be computed from elevation data in the GIS.
 An example of use of layers in a GIS application. In this example, the forest cover layer (light green) is at the bottom, with the topographic layer over it. Next up is the stream layer, then the boundary layer, then the road layer. The order is very important in order to properly display the final result. Note that the pond layer was located just below the stream layer, so that a stream line can be seen overlying one of the ponds.The term "cartographic modeling" was (probably) coined by Dana Tomlin in his PhD dissertation and later in his book which has the term in the title. Cartographic modeling refers to a process where several thematic layers of the same area are produced, processed, and analyzed. Tomlin used raster layers, but the overlay method (see below) can be used more generally. Operations on map layers can be combined into algorithms, and eventually into simulation or optimization models.
Data extraction is a GIS process similar to vector overlay, though it can be used in either vector or raster data analysis. Rather than combining the properties and features of both datasets, data extraction involves using a "clip" or "mask" to extract the features of one data set that fall within the spatial extent of another dataset.
In raster data analysis, the overlay of datasets is accomplished through a process known as "local operation on multiple rasters" or "map algebra," through a function that combines the values of each raster's matrix. This function may weigh some inputs more than others through use of an "index model" that reflects the influence of various factors upon a geographic phenomenon.
When phenomena are measured, the observation methods dictate the accuracy of any subsequent analysis. Due to the nature of the data (e.g. traffic patterns in an urban environment; weather patterns over the Pacific Ocean), a constant or dynamic degree of precision is always lost in the measurement. This loss of precision is determined from the scale and distribution of the data collection.
To determine the statistical relevance of the analysis, an average is determined so that points (gradients) outside of any immediate measurement can be included to determine their predicted behavior. This is due to the limitations of the applied statistic and data collection methods, and interpolation is required to predict the behavior of particles, points, and locations that are not directly measurable.
 Hillshade model derived from a Digital Elevation Model (DEM) of the Valestra area in the northern Apennines (Italy)Interpolation is the process by which a surface is created, usually a raster dataset, through the input of data collected at a number of sample points. There are several forms of interpolation, each which treats the data differently, depending on the properties of the data set. In comparing interpolation methods, the first consideration should be whether or not the source data will change (exact or approximate). Next is whether the method is subjective, a human interpretation, or objective. Then there is the nature of transitions between points: are they abrupt or gradual. Finally, there is whether a method is global (it uses the entire data set to form the model), or local where an algorithm is repeated for a small section of terrain.
Interpolation is a justified measurement because of a spatial autocorrelation principle that recognizes that data collected at any position will have a great similarity to, or influence of those locations within its immediate vicinity.
Digital elevation models (DEM), triangulated irregular networks (TIN), edge finding algorithms, Thiessen polygons, Fourier analysis, (weighted) moving averages, inverse distance weighting, kriging, spline, and trend surface analysis are all mathematical methods to produce interpolative data.
There are several potentially dangerous caveats that are often overlooked when using interpolation. See the full entry for Geocoding for more information.
Various algorithms are used to help with address matching when the spellings of addresses differ. Address information that a particular entity or organization has data on, such as the post office, may not entirely match the reference theme. There could be variations in street name spelling, community name, etc. Consequently, the user generally has the ability to make matching criteria more stringent, or to relax those parameters so that more addresses will be mapped. Care must be taken to review the results so as not to map addresses incorrectly due to overzealous matching parameters.
Cartographic work serves two major functions:
First, it produces graphics on the screen or on paper that convey the results of analysis to the people who make decisions about resources. Wall maps and other graphics can be generated, allowing the viewer to visualize and thereby understand the results of analyses or simulations of potential events. Web Map Servers facilitate distribution of generated maps through web browsers using various implementations of web-based application programming interfaces (AJAX, Java, Flash, etc.).
Second, other database information can be generated for further analysis or use. An example would be a list of all addresses within one mile (1.6 km) of a toxic spill.
Today, graphic display techniques such as shading based on altitude in a GIS can make relationships among map elements visible, heightening one's ability to extract and analyze information. For example, two types of data were combined in a GIS to produce a perspective view of a portion of San Mateo County, California.
An archeochrome is a new way of displaying spatial data. It is a thematic on a 3D map that is applied to a specific building or a part of a building. It is suited to the visual display of heat loss data.
SOURCE:http://en.wikipedia.org/wiki/Geographic_information_system
you may also like: MOST READ
A GIS can be thought of as a system - it digitally creates and "manipulates" spatial areas that may be jurisdictional, purpose or application-oriented for which a specific GIS is developed. Hence, a GIS developed for an application, jurisdiction, enterprise or purpose may not be necessarily interoperable or compatible with a GIS that has been developed for some other application, jurisdiction, enterprise, or purpose. What goes beyond a GIS is a spatial data infrastructure (SDI), a concept that has no such restrictive boundaries.
Therefore, in a general sense, the term describes any information system that integrates, stores, edits, analyzes, shares and displays geographic information for informing decision making. GIS applications are tools that allow users to create interactive queries (user-created searches), analyze spatial information, edit data, maps, and present the results of all these operations.[1] Geographic information science is the science underlying the geographic concepts, applications and systems.
Applications
GIS technology can be used for:- earth surface-based scientific investigations;
- resource management
- reference and projections of a geospatial nature, both man-made and natural;
- asset management and location planning
- archaeology;
- environmental impact-assessment;
- infrastructure assessment and development;
- urban planning;
- cartography, for a thematic and/or time-based purpose;
- criminology;
- geospatial intelligence;
- GIS data development;
- geographic history;
- marketing;
- logistics;
- population and demographic studies;
- prospectivity mapping;
- statistical analysis;
- military planning; and
- other purposes.
- GIS may allow emergency planners to easily calculate emergency response times and the movement of response resources (for logistics) in the case of a natural disaster;
- GIS might be used to find wetlands that need protection strategies regarding pollution; and
- GIS can be used by a company to site a new business location to take advantage of GIS data identified trends to respond to a previously under-served market. Most city and transportation systems planning offices have GIS sections.
History of development
In 1854, John Snow depicted a cholera outbreak in London using points to represent the locations of some individual cases, possibly the earliest use of the geographic method.[3] His study of the distribution of cholera led to the source of the disease, a contaminated water pump (the Broad Street Pump, whose handle he had disconnected, thus terminating the outbreak) within the heart of the cholera outbreak.
The early 20th century saw the development of photozincography, which allowed maps to be split into layers, for example one layer for vegetation and another for water. This was particularly used for printing contours - drawing these was a labour intensive task but having them on a separate layer meant they could be worked on without the other layers to confuse the draughtsman. This work was originally drawn on glass plates but later, plastic film was introduced, being lighter, using less storage space and being less brittle were several of its advantages over glass plates. When all the layers were finished, they were combined into one image using a large process camera. Once colour printing came in, the layers idea was also used for creating separate printing plates for each colour. While the use of layers much later became one of the main typical features of a contemporary GIS, the photographic process just described is not considered to be a GIS in itself - as the maps were just images with no database to link them to.
Computer hardware development spurred by nuclear weapon research led to general-purpose computer 'mapping' applications by the early 1960s.[4]
The year 1960 saw the development of the world's first true operational GIS in Ottawa, Ontario, Canada by the federal Department of Forestry and Rural Development. Developed by Dr. Roger Tomlinson, it was called the Canada Geographic Information System (CGIS) and was used to store, analyze, and manipulate data collected for the Canada Land Inventory (CLI) – an effort to determine the land capability for rural Canada by mapping information about soils, agriculture, recreation, wildlife, waterfowl, forestry and land use at a scale of 1:50,000. A rating classification factor was also added to permit analysis.
CGIS was an improvement over 'computer mapping' applications as it provided capabilities for overlay, measurement and digitizing/scanning. It supported a national coordinate system that spanned the continent, coded lines as arcs having a true embedded topology and it stored the attribute and locational information in separate files. As a result of this, Tomlinson has become known as the 'father of GIS', particularly for his use of overlays in promoting the spatial analysis of convergent geographic data.[5]
CGIS lasted into the 1990s and built a large digital land resource database in Canada. It was developed as a mainframe-based system in support of federal and provincial resource planning and management. Its strength was continent-wide analysis of complex datasets. The CGIS was never available in a commercial form.
In 1964, Howard T. Fisher formed the Laboratory for Computer Graphics and Spatial Analysis at the Harvard Graduate School of Design (LCGSA 1965-1991), where a number of important theoretical concepts in spatial data handling were developed, and which by the 1970s had distributed seminal software code and systems, such as 'SYMAP', 'GRID' and 'ODYSSEY' - that served as sources for subsequent commercial development — to universities, research centers and corporations worldwide.[6]
By the early 1980s, M&S Computing (later Intergraph), Environmental Systems Research Institute (ESRI), CARIS (Computer Aided Resource Information System) and ERDAS emerged as commercial vendors of GIS software, successfully incorporating many of the CGIS features, combining the first generation approach to separation of spatial and attribute information with a second generation approach to organizing attribute data into database structures. In parallel, the development of two public domain systems began in the late 1970s and early 1980s.[7]
The Map Overlay and Statistical System (MOSS) project started in 1977 in Fort Collins, Colorado under the auspices of the Western Energy and Land Use Team (WELUT) and the US Fish and Wildlife Service. GRASS GIS was introduced in 1982 by the US Army Corps of Engineering Research Laboratory (USA-CERL) in Champaign, Illinois, a branch of the US Army Corps of Engineers to meet the need of the US military for software for land management and environmental planning.
In the later 1980s and 1990s, industry growth was spurred on by the growing use of GIS on Unix workstations and the personal computer. By the end of the 20th century, the rapid growth in various systems had been consolidated and standardized on relatively few platforms and users were beginning to explore the concept of viewing GIS data over the Internet, requiring data format and transfer standards. More recently, a growing number of free, open-source GIS packages run on a range of operating systems and can be customized to perform specific tasks. Increasingly geospatial data and mapping applications are being made available via the world wide web.[8]
Several authoritative books on the history of GIS have been published.[9][10]
GIS techniques and technology
Modern GIS technologies use digital information, for which various digitized data creation methods are used. The most common method of data creation is digitization, where a hard copy map or survey plan is transferred into a digital medium through the use of a computer-aided design (CAD) program, and geo-referencing capabilities. With the wide availability of ortho-rectified imagery (both from satellite and aerial sources), heads-up digitizing is becoming the main avenue through which geographic data is extracted. Heads-up digitizing involves the tracing of geographic data directly on top of the aerial imagery instead of by the traditional method of tracing the geographic form on a separate digitizing tablet (heads-down digitizing).Relating information from different sources
GIS uses spatio-temporal (space-time) location as the key index variable for all other information. Just as a relational database containing text or numbers can relate many different tables using common key index variables, GIS can relate otherwise unrelated information by using location as the key index variable. The key is the location and/or extent in space-time.Any variable that can be located spatially, and increasingly also temporally, can be referenced using a GIS. Locations or extents in Earth space-time may be recorded as dates/times of occurrence, and x, y, and z coordinates representing, longitude, latitude, and elevation, respectively. These GIS coordinates may represent other quantified systems of temporo-spatial reference (for example, film frame number, stream gage station, highway mile marker, surveyor benchmark, building address, street intersection, entrance gate, water depth sounding, POS or CAD drawing origin/units). Units applied to recorded temporal-spatial data can vary widely (even when using exactly the same data, see map projections), but all Earth-based spatial-temporal location and extent references should, ideally, be relatable to one another and ultimately to a "real" physical location or extent in space-time.
Related by accurate spatial information, an incredible variety of real-world and projected past or future data can be analyzed, interpreted and represented to facilitate education and decision making.[11] This key characteristic of GIS has begun to open new avenues of scientific inquiry into behaviors and patterns of previously considered unrelated real-world information.
GIS Uncertainties
GIS accuracy depends upon source data, and how it is encoded to be data referenced. Land Surveyors have been able to provide a high level of positional accuracy utilizing the GPS derived positions.[12] [Retrieved from Federal Geographic Data Committee] the high-resolution digital terrain and aerial imagery,[13] [Retrieved NJGIN] the powerful computers, Web technology, are changing the quality, utility, and expectations of GIS to serve society on a grand scale, but nevertheless there are other source data that has an impact on the overall GIS accuracy like: paper maps that are not found to be very suitable to achieve the desired accuracy since the aging of maps affects their dimensional stability.In developing a Digital Topographic Data Base for a GIS, topographical maps are the main source of data. Aerial photography and satellite images are extra sources for collecting data and identifying attributes which can be mapped in layers over a location facsimile of scale. The scale of a map and geographical rendering area representation type are very important aspects since the information content depends mainly on the scale set and resulting locatability of the map's representations. In order to digitize a map, the map has to be checked within theoretical dimensions, then scanned into a raster format, and resulting raster data has to be given a theoretical dimension by a rubber sheeting/warping technology process.
Uncertainty is a significant problem in designing a GIS because spatial data tend to be used for purposes for which they were never intended. Some maps were made many decades ago, where at that time the computer industry was not even in its perspective establishments. This has led to historical reference maps without common norms. Map accuracy is a relative issue of minor importance in cartography. All maps are established for communication ends. Maps use a historically constrained technology of pen and paper to communicate a view of the world to their users. Cartographers feel little need to communicate information based on accuracy, for when the same map is digitized and input into a GIS, the mode of use often changes. The new uses extend well beyond a determined domain for which the original map was intended and designed.
A quantitative analysis of maps brings accuracy issues into focus. The electronic and other equipment used to make measurements for GIS is far more precise than the machines of conventional map analysis.[14] [Retrieved USGS]. The truth is that all geographical data are inherently inaccurate, and these inaccuracies will propagate through GIS operations in ways that are difficult to predict, yet have goals of conveyance in mind for original design. Accuracy Standards for 1:24000 Scales Map: 1:24,000 ± 40.00 feet
This means that when we see a point or attribute on a map, its "probable" location is within a +/- 40 foot area of its rendered reference, according to area representations and scale.
A GIS can also convert existing digital information, which may not yet be in map form, into forms it can recognize, employ for its data analysis processes, and use in forming mapping output. For example, digital satellite images generated through remote sensing can be analyzed to produce a map-like layer of digital information about vegetative covers on land locations. Another fairly recently developed resource for naming GIS location objects is the Getty Thesaurus of Geographic Names (GTGN), which is a structured vocabulary containing about 1,000,000 names and other information about places.[15]
Likewise, researched census or hydrological tabular data can be displayed in map-like form, serving as layers of thematic information for forming a GIS map.
Data representation
GIS data represents real objects (such as roads, land use, elevation, trees, waterways, etc.) with digital data determining the mix. Real objects can be divided into two abstractions: discrete objects (e.g., a house) and continuous fields (such as rainfall amount, or elevations). Traditionally, there are two broad methods used to store data in a GIS for both kinds of abstractions mapping references: raster images and vector. Points, lines, and polygons are the stuff of mapped location attribute references. A new hybrid method of storing data is that of identifying point clouds, which combine three-dimensional points with RGB information at each point, returning a "3D color image". GIS Thematic maps then are becoming more and more realistically visually descriptive of what they set out to show or determine.Raster
A raster data type is, in essence, any type of digital image represented by reducible and enlargeable grids. Anyone who is familiar with digital photography will recognize the Raster graphics pixel as the smallest individual grid unit building block of an image, usually not readily identified as an artifact shape until an image is produced on a very large scale. A combination of the pixels making up an image color formation scheme will compose details of an image, as is distinct from the commonly used points, lines, and polygon area location symbols of scalable vector graphics as the basis of the vector model of area attribute rendering. While a digital image is concerned with its output blending together its grid based details as an identifiable representation of reality, in a photograph or art image transferred into a computer, the raster data type will reflect a digitized abstraction of reality dealt with by grid populating tones or objects, quantities, cojoined or open boundaries, and map relief schemas. Aerial photos are one commonly used form of raster data, with one primary purpose in mind: to display a detailed image on a map area, or for the purposes of rendering its identifiable objects by digitization. Additional raster data sets used by a GIS will contain information regarding elevation, a digital elevation model, or reflectance of a particular wavelength of light, Landsat, or other electromagnetic spectrum indicators.
Digital elevation model, map (image), and vector data
Raster data is stored in various formats; from a standard file-based structure of TIF, JPEG, etc. to binary large object (BLOB) data stored directly in a relational database management system (RDBMS) similar to other vector-based feature classes. Database storage, when properly indexed, typically allows for quicker retrieval of the raster data but can require storage of millions of significantly sized records.
Vector
In a GIS, geographical features are often expressed as vectors, by considering those features as geometrical shapes. Different geographical features are expressed by different types of geometry:
- Zero-dimensional points are used for geographical features that can best be expressed by a single point reference — in other words, by simple location. Examples include wells, peaks, features of interest, and trailheads. Points convey the least amount of information of these file types. Points can also be used to represent areas when displayed at a small scale. For example, cities on a map of the world might be represented by points rather than polygons. No measurements are possible with point features.
- Lines or polylines
- One-dimensional lines or polylines are used for linear features such as rivers, roads, railroads, trails, and topographic lines. Again, as with point features, linear features displayed at a small scale will be represented as linear features rather than as a polygon. Line features can measure distance.
- Two-dimensional polygons are used for geographical features that cover a particular area of the earth's surface. Such features may include lakes, park boundaries, buildings, city boundaries, or land uses. Polygons convey the most amount of information of the file types. Polygon features can measure perimeter and area.
Vector features can be made to respect spatial integrity through the application of topology rules such as 'polygons must not overlap'. Vector data can also be used to represent continuously varying phenomena. Contour lines and triangulated irregular networks (TIN) are used to represent elevation or other continuously changing values. TINs record values at point locations, which are connected by lines to form an irregular mesh of triangles. The face of the triangles represent the terrain surface.
Advantages and disadvantages
There are some important advantages and disadvantages to using a raster or vector data model to represent reality:- Raster datasets record a value for all points in the area covered which may require more storage space than representing data in a vector format that can store data only where needed.
- Raster data allows easy implementation of overlay operations, which are more difficult with vector data.
- Vector data can be displayed as vector graphics used on traditional maps, whereas raster data will appear as an image that may have a blocky appearance for object boundaries. (depending on the resolution of the raster file)
- Vector data can be easier to register, scale, and re-project, which can simplify combining vector layers from different sources.
- Vector data is more compatible with relational database environments, where they can be part of a relational table as a normal column and processed using a multitude of operators.
- Vector file sizes are usually smaller than raster data, which can be 10 to 100 times larger than vector data (depending on resolution).
- Vector data is simpler to update and maintain, whereas a raster image will have to be completely reproduced. (Example: a new road is added).
- Vector data allows much more analysis capability, especially for "networks" such as roads, power, rail, telecommunications, etc. (Examples: Best route, largest port, airfields connected to two-lane highways). Raster data will not have all the characteristics of the features it displays.
Non-spatial data
Additional non-spatial data can also be stored along with the spatial data represented by the coordinates of a vector geometry or the position of a raster cell. In vector data, the additional data contains attributes of the feature. For example, a forest inventory polygon may also have an identifier value and information about tree species. In raster data the cell value can store attribute information, but it can also be used as an identifier that can relate to records in another table.Software is currently being developed to support spatial and non-spatial decision-making, with the solutions to spatial problems being integrated with solutions to non-spatial problems. The end result with these Flexible Spatial Decision-Making Support Systems (FSDSS)[16] is expected to be that non-experts will be able to use GIS, along with spatial criteria, and simply integrate their non-spatial criteria to view solutions to multi-criteria problems. This system is intended to assist decision-making.
Data capture

Existing data printed on paper or PET film maps can be digitized or scanned to produce digital data. A digitizer produces vector data as an operator traces points, lines, and polygon boundaries from a map. Scanning a map results in raster data that could be further processed to produce vector data.
Survey data can be directly entered into a GIS from digital data collection systems on survey instruments using a technique called Coordinate Geometry (COGO). Positions from a Global Navigation Satellite System (GNSS) like Global Positioning System (GPS), another survey tool, can also be directly entered into a GIS. Current trend is data collection and field mapping carried out directly with field computers (position from GPS and/or laser rangefinder). New technologies allow to create maps as well as analysis directly in the field, projects are more efficient and mapping is more accurate.
Remotely sensed data also plays an important role in data collection and consist of sensors attached to a platform. Sensors include cameras, digital scanners and LIDAR, while platforms usually consist of aircraft and satellites.
The majority of digital data currently comes from photo interpretation of aerial photographs. Soft copy workstations are used to digitize features directly from stereo pairs of digital photographs. These systems allow data to be captured in two and three dimensions, with elevations measured directly from a stereo pair using principles of photogrammetry. Currently, analog aerial photos are scanned before being entered into a soft copy system, but as high quality digital cameras become cheaper this step will be skipped.
Satellite remote sensing provides another important source of spatial data. Here satellites use different sensor packages to passively measure the reflectance from parts of the electromagnetic spectrum or radio waves that were sent out from an active sensor such as radar. Remote sensing collects raster data that can be further processed using different bands to identify objects and classes of interest, such as land cover.
When data is captured, the user should consider if the data should be captured with either a relative accuracy or absolute accuracy, since this could not only influence how information will be interpreted but also the cost of data capture.
In addition to collecting and entering spatial data, attribute data is also entered into a GIS. For vector data, this includes additional information about the objects represented in the system.
After entering data into a GIS, the data usually requires editing, to remove errors, or further processing. For vector data it must be made "topologically correct" before it can be used for some advanced analysis. For example, in a road network, lines must connect with nodes at an intersection. Errors such as undershoots and overshoots must also be removed. For scanned maps, blemishes on the source map may need to be removed from the resulting raster. For example, a fleck of dirt might connect two lines that should not be connected.
Raster-to-vector translation
Data restructuring can be performed by a GIS to convert data into different formats. For example, a GIS may be used to convert a satellite image map to a vector structure by generating lines around all cells with the same classification, while determining the cell spatial relationships, such as adjacency or inclusion.More advanced data processing can occur with image processing, a technique developed in the late 1960s by NASA and the private sector to provide contrast enhancement, false colour rendering and a variety of other techniques including use of two dimensional Fourier transforms.
Since digital data is collected and stored in various ways, the two data sources may not be entirely compatible. So a GIS must be able to convert geographic data from one structure to another.
Projections, coordinate systems and registration
A property ownership map and a soils map might show data at different scales. Map information in a GIS must be manipulated so that it registers, or fits, with information gathered from other maps. Before the digital data can be analyzed, they may have to undergo other manipulations—projection and coordinate conversions, for example—that integrate them into a GIS.The earth can be represented by various models, each of which may provide a different set of coordinates (e.g., latitude, longitude, elevation) for any given point on the Earth's surface. The simplest model is to assume the earth is a perfect sphere. As more measurements of the earth have accumulated, the models of the earth have become more sophisticated and more accurate. In fact, there are models that apply to different areas of the earth to provide increased accuracy (e.g., North American Datum, 1927 - NAD27 - works well in North America, but not in Europe). See datum (geodesy) for more information.
Projection is a fundamental component of map making. A projection is a mathematical means of transferring information from a model of the Earth, which represents a three-dimensional curved surface, to a two-dimensional medium—paper or a computer screen. Different projections are used for different types of maps because each projection particularly suits specific uses. For example, a projection that accurately represents the shapes of the continents will distort their relative sizes. See Map projection for more information.
Since much of the information in a GIS comes from existing maps, a GIS uses the processing power of the computer to transform digital information, gathered from sources with different projections and/or different coordinate systems, to a common projection and coordinate system. For images, this process is called rectification.
Spatial analysis with GIS
Given the vast range of spatial analysis techniques that have been developed over the past half century, any summary or review can only cover the subject to a limited depth. This is a rapidly changing field, and GIS packages are increasingly including analytical tools as standard built-in facilities or as optional toolsets, add-ins or 'analysts'. In many instances such facilities are provided by the original software suppliers (commercial vendors or collaborative non commercial development teams), whilst in other cases facilities have been developed and are provided by third parties. Furthermore, many products offer software development kits (SDKs), programming languages and language support, scripting facilities and/or special interfaces for developing one’s own analytical tools or variants. The website Geospatial Analysis and associated book/ebook attempt to provide a reasonably comprehensive guide to the subject.[17] The impact of these myriad paths to perform spatial analysis create a new dimension to business intelligence termed "spatial intelligence" which, when delivered via intranet, democratizes access to operational sorts not usually privy to this type of information.Slope and Aspect
Slope, aspect and surface curvature in terrain analysis are all derived from neighbourhood operations using elevation values of a cell’s adjacent neighbours.[18] Authors such as Skidmore,[19] Jones[20] and Zhou and Liu[21] have compared techniques for calculating slope and aspect. Slope is a function of resolution, and the spatial resolution used to calculate slope and aspect should always be specified [22]The elevation at a point will have perpendicular tangents (slope) passing through the point, in an east-west and north-south direction. These two tangents give two components, ∂z/∂x and ∂z/∂y, which then be used to determine the overall direction of slope, and the aspect of the slope. The gradient is defined as a vector quantity with components equal to the partial derivatives of the surface in the x and y directions.[23]
The calculation of the overall 3x3 grid slope and aspect for methods that determine east-west and north-south component use the following formulas respectively:
Zhou and Liu[21] describe another algorithm for calculating aspect, as follows:
Data modeling
It is difficult to relate wetlands maps to rainfall amounts recorded at different points such as airports, television stations, and high schools. A GIS, however, can be used to depict two- and three-dimensional characteristics of the Earth's surface, subsurface, and atmosphere from information points. For example, a GIS can quickly generate a map with isopleth or contour lines that indicate differing amounts of rainfall.Such a map can be thought of as a rainfall contour map. Many sophisticated methods can estimate the characteristics of surfaces from a limited number of point measurements. A two-dimensional contour map created from the surface modeling of rainfall point measurements may be overlaid and analyzed with any other map in a GIS covering the same area.
Additionally, from a series of three-dimensional points, or digital elevation model, isopleth lines representing elevation contours can be generated, along with slope analysis, shaded relief, and other elevation products. Watersheds can be easily defined for any given reach, by computing all of the areas contiguous and uphill from any given point of interest. Similarly, an expected thalweg of where surface water would want to travel in intermittent and permanent streams can be computed from elevation data in the GIS.
Topological modeling
A GIS can recognize and analyze the spatial relationships that exist within digitally stored spatial data. These topological relationships allow complex spatial modelling and analysis to be performed. Topological relationships between geometric entities traditionally include adjacency (what adjoins what), containment (what encloses what), and proximity (how close something is to something else).Networks
Geometric networks are linear networks of objects that can be used to represent interconnected features, and to perform special spatial analysis on them. A geometric network is composed of edges, which are connected at junction points, similar to graphs in mathematics and computer science. Just like graphs, networks can have weight and flow assigned to its edges, which can be used to represent various interconnected features more accurately. Geometric networks are often used to model road networks and public utility networks, such as electric, gas, and water networks. Network modeling is also commonly employed in transportation planning, hydrology modeling, and infrastructure modeling.Hydrological Modeling
GIS hydrological models can provide a spatial element that other hydrological models lack, with the analysis of variables such as slope, aspect and watershed or catchment area.[24] Terrain analysis is fundamental to hydrology, since water always flows down a slope.[24] As basic terrain analysis of a DEM involves calculation of slope and aspect, DEMs are very useful for hydrological analysis. Slope and aspect can then be used to determine direction of surface runoff, and hence flow accumulation for the formation of streams, rivers and lakes. Areas of divergent flow can also give a clear indication of the boundaries of a catchment. Once a flow direction and accumulation matrix has been created, queries can be performed that show contributing or dispersal areas at a certain point.[24] More detail can be added to the model, such as terrain roughness, vegetation types and soil types, which can influence infiltration and evapotranspiration rates, and hence influencing surface flow. These extra layers of detail ensures a more accurate model.Cartographic modeling

Map overlay
The combination of several spatial datasets (points, lines or polygons) creates a new output vector dataset, visually similar to stacking several maps of the same region. These overlays are similar to mathematical Venn diagram overlays. A union overlay combines the geographic features and attribute tables of both inputs into a single new output. An intersect overlay defines the area where both inputs overlap and retains a set of attribute fields for each. A symmetric difference overlay defines an output area that includes the total area of both inputs except for the overlapping area.Data extraction is a GIS process similar to vector overlay, though it can be used in either vector or raster data analysis. Rather than combining the properties and features of both datasets, data extraction involves using a "clip" or "mask" to extract the features of one data set that fall within the spatial extent of another dataset.
In raster data analysis, the overlay of datasets is accomplished through a process known as "local operation on multiple rasters" or "map algebra," through a function that combines the values of each raster's matrix. This function may weigh some inputs more than others through use of an "index model" that reflects the influence of various factors upon a geographic phenomenon.
Automated cartography
Digital cartography and GIS both encode spatial relationships in structured formal representations. GIS is used in digital cartography modeling as a (semi)automated process of making maps, so called Automated Cartography. In practice, it can be a subset of a GIS, within which it is equivalent to the stage of visualization, since in most cases not all of the GIS functionality is used. Cartographic products can be either in a digital or in a hardcopy format. Powerful analysis techniques with different data representation can produce high-quality maps within a short time period. The main problem in Automated Cartography is to use a single set of data to produce multiple products at a variety of scales, a technique known as cartographic generalization.Geostatistics
Main article: Geostatistics
Geostatistics is a point-pattern analysis that produces field predictions from data points. It is a way of looking at the statistical properties of those special data. It is different from general applications of statistics because it employs the use of graph theory and matrix algebra to reduce the number of parameters in the data. Only the second-order properties of the GIS data are analyzed.When phenomena are measured, the observation methods dictate the accuracy of any subsequent analysis. Due to the nature of the data (e.g. traffic patterns in an urban environment; weather patterns over the Pacific Ocean), a constant or dynamic degree of precision is always lost in the measurement. This loss of precision is determined from the scale and distribution of the data collection.
To determine the statistical relevance of the analysis, an average is determined so that points (gradients) outside of any immediate measurement can be included to determine their predicted behavior. This is due to the limitations of the applied statistic and data collection methods, and interpolation is required to predict the behavior of particles, points, and locations that are not directly measurable.

Interpolation is a justified measurement because of a spatial autocorrelation principle that recognizes that data collected at any position will have a great similarity to, or influence of those locations within its immediate vicinity.
Digital elevation models (DEM), triangulated irregular networks (TIN), edge finding algorithms, Thiessen polygons, Fourier analysis, (weighted) moving averages, inverse distance weighting, kriging, spline, and trend surface analysis are all mathematical methods to produce interpolative data.
Address geocoding
Main article: Geocoding
Geocoding is interpolating spatial locations (X,Y coordinates) from street addresses or any other spatially referenced data such as ZIP Codes, parcel lots and address locations. A reference theme is required to geocode individual addresses, such as a road centerline file with address ranges. The individual address locations have historically been interpolated, or estimated, by examining address ranges along a road segment. These are usually provided in the form of a table or database. The GIS will then place a dot approximately where that address belongs along the segment of centerline. For example, an address point of 500 will be at the midpoint of a line segment that starts with address 1 and ends with address 1000. Geocoding can also be applied against actual parcel data, typically from municipal tax maps. In this case, the result of the geocoding will be an actually positioned space as opposed to an interpolated point. This approach is being increasingly used to provide more precise location information.There are several potentially dangerous caveats that are often overlooked when using interpolation. See the full entry for Geocoding for more information.
Various algorithms are used to help with address matching when the spellings of addresses differ. Address information that a particular entity or organization has data on, such as the post office, may not entirely match the reference theme. There could be variations in street name spelling, community name, etc. Consequently, the user generally has the ability to make matching criteria more stringent, or to relax those parameters so that more addresses will be mapped. Care must be taken to review the results so as not to map addresses incorrectly due to overzealous matching parameters.
Reverse geocoding
Reverse geocoding is the process of returning an estimated street address number as it relates to a given coordinate. For example, a user can click on a road centerline theme (thus providing a coordinate) and have information returned that reflects the estimated house number. This house number is interpolated from a range assigned to that road segment. If the user clicks at the midpoint of a segment that starts with address 1 and ends with 100, the returned value will be somewhere near 50. Note that reverse geocoding does not return actual addresses, only estimates of what should be there based on the predetermined range.Data output and cartography
Cartography is the design and production of maps, or visual representations of spatial data. The vast majority of modern cartography is done with the help of computers, usually using a GIS but production quality cartography is also achieved by importing layers into a design program to refine it. Most GIS software gives the user substantial control over the appearance of the data.Cartographic work serves two major functions:
First, it produces graphics on the screen or on paper that convey the results of analysis to the people who make decisions about resources. Wall maps and other graphics can be generated, allowing the viewer to visualize and thereby understand the results of analyses or simulations of potential events. Web Map Servers facilitate distribution of generated maps through web browsers using various implementations of web-based application programming interfaces (AJAX, Java, Flash, etc.).
Second, other database information can be generated for further analysis or use. An example would be a list of all addresses within one mile (1.6 km) of a toxic spill.
Graphic display techniques
Traditional maps are abstractions of the real world, a sampling of important elements portrayed on a sheet of paper with symbols to represent physical objects. People who use maps must interpret these symbols. Topographic maps show the shape of land surface with contour lines or with shaded relief.Today, graphic display techniques such as shading based on altitude in a GIS can make relationships among map elements visible, heightening one's ability to extract and analyze information. For example, two types of data were combined in a GIS to produce a perspective view of a portion of San Mateo County, California.
- The digital elevation model, consisting of surface elevations recorded on a 30-meter horizontal grid, shows high elevations as white and low elevation as black.
- The accompanying Landsat Thematic Mapper image shows a false-color infrared image looking down at the same area in 30-meter pixels, or picture elements, for the same coordinate points, pixel by pixel, as the elevation information.
An archeochrome is a new way of displaying spatial data. It is a thematic on a 3D map that is applied to a specific building or a part of a building. It is suited to the visual display of heat loss data.
Spatial ETL
Spatial ETL tools provide the data processing functionality of traditional Extract, Transform, Load (ETL) software, but with a primary focus on the ability to manage spatial data. They provide GIS users with the ability to translate data between different standards and proprietary formats, whilst geometrically transforming the data en-route.SOURCE:http://en.wikipedia.org/wiki/Geographic_information_system
you may also like: MOST READ
Mechanical engineering
Mechanical engineering is a discipline of engineering that applies the principles of physics and materials science for analysis, design, manufacturing, and maintenance of mechanical systems. It is the branch of engineering that involves the production and usage of heat and mechanical power for the design, production, and operation of machines and tools.[1] It is one of the oldest and broadest engineering disciplines.
The engineering field requires an understanding of core concepts including mechanics, kinematics, thermodynamics, materials science, and structural analysis. Mechanical engineers use these core principles along with tools like computer-aided engineering and product lifecycle management to design and analyze manufacturing plants, industrial equipment and machinery, heating and cooling systems, transport systems, aircraft, watercraft, robotics, medical devices and more.
Mechanical engineering emerged as a field during the industrial revolution in Europe in the 18th century; however, its development can be traced back several thousand years around the world. Mechanical engineering science emerged in the 19th century as a result of developments in the field of physics. The field has continually evolved to incorporate advancements in technology, and mechanical engineers today are pursuing developments in such fields as composites, mechatronics, and nanotechnology. Mechanical engineering overlaps with aerospace engineering, civil engineering, electrical engineering, petroleum engineering, and chemical engineering to varying amounts.
In Australia, mechanical engineering degrees are awarded as Bachelor of Engineering (Mechanical). The degree takes four years of full time study to achieve. To ensure quality in engineering degrees, the Australian Institution of Engineers accredits engineering degrees awarded by Australian universities. Before the degree can be awarded, the student must complete at least 3 months of on the job work experience in an engineering firm.
In the United States, most undergraduate mechanical engineering programs are accredited by the Accreditation Board for Engineering and Technology (ABET) to ensure similar course requirements and standards among universities. The ABET web site lists 276 accredited mechanical engineering programs as of June 19, 2006.[9] Mechanical engineering programs in Canada are accredited by the Canadian Engineering Accreditation Board (CEAB),[10] and most other countries offering engineering degrees have similar accreditation societies.
Some mechanical engineers go on to pursue a postgraduate degree such as a Master of Engineering, Master of Technology, Master of Science, Master of Engineering Management (MEng.Mgt or MEM), a Doctor of Philosophy in engineering (EngD, PhD) or an engineer's degree. The master's and engineer's degrees may or may not include research. The Doctor of Philosophy includes a significant research component and is often viewed as the entry point to academia.[11] The Engineer's degree exists at a few institutions at an intermediate level between the master's degree and the doctorate.
The fundamental subjects of mechanical engineering usually include:
In addition to the core mechanical engineering curriculum, many mechanical engineering programs offer more specialized programs and classes, such as robotics, transport and logistics, cryogenics, fuel technology, automotive engineering, biomechanics, vibration, optics and others, if a separate department does not exist for these subjects.[15]
Most mechanical engineering programs also require varying amounts of research or community projects to gain practical problem-solving experience. In the United States it is common for mechanical engineering students to complete one or more internships while studying, though this is not typically mandated by the university. Cooperative education is another option.
In 2007, Canadian engineers made an average of CAD$29.83 per hour with 4% unemployed. The average for all occupations was $18.07 per hour with 7% unemployed. Twelve percent of these engineers were self-employed, and since 1997 the proportion of female engineers had risen to 6%.
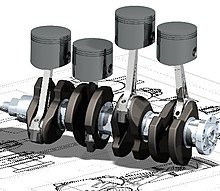 An oblique view of a four-cylinder inline crankshaft with pistonsMany mechanical engineering companies, especially those in industrialized nations, have begun to incorporate computer-aided engineering (CAE) programs into their existing design and analysis processes, including 2D and 3D solid modeling computer-aided design (CAD). This method has many benefits, including easier and more exhaustive visualization of products, the ability to create virtual assemblies of parts, and the ease of use in designing mating interfaces and tolerances.
Other CAE programs commonly used by mechanical engineers include product lifecycle management (PLM) tools and analysis tools used to perform complex simulations. Analysis tools may be used to predict product response to expected loads, including fatigue life and manufacturability. These tools include finite element analysis (FEA), computational fluid dynamics (CFD), and computer-aided manufacturing (CAM).
Using CAE programs, a mechanical design team can quickly and cheaply iterate the design process to develop a product that better meets cost, performance, and other constraints. No physical prototype need be created until the design nears completion, allowing hundreds or thousands of designs to be evaluated, instead of a relative few. In addition, CAE analysis programs can model complicated physical phenomena which cannot be solved by hand, such as viscoelasticity, complex contact between mating parts, or non-Newtonian flows
As mechanical engineering begins to merge with other disciplines, as seen in mechatronics, multidisciplinary design optimization (MDO) is being used with other CAE programs to automate and improve the iterative design process. MDO tools wrap around existing CAE processes, allowing product evaluation to continue even after the analyst goes home for the day. They also utilize sophisticated optimization algorithms to more intelligently explore possible designs, often finding better, innovative solutions to difficult multidisciplinary design problems.
SOURCE:http://en.wikipedia.org/wiki/Mechanical_engineering
you may also like: MOST READ
The engineering field requires an understanding of core concepts including mechanics, kinematics, thermodynamics, materials science, and structural analysis. Mechanical engineers use these core principles along with tools like computer-aided engineering and product lifecycle management to design and analyze manufacturing plants, industrial equipment and machinery, heating and cooling systems, transport systems, aircraft, watercraft, robotics, medical devices and more.
Mechanical engineering emerged as a field during the industrial revolution in Europe in the 18th century; however, its development can be traced back several thousand years around the world. Mechanical engineering science emerged in the 19th century as a result of developments in the field of physics. The field has continually evolved to incorporate advancements in technology, and mechanical engineers today are pursuing developments in such fields as composites, mechatronics, and nanotechnology. Mechanical engineering overlaps with aerospace engineering, civil engineering, electrical engineering, petroleum engineering, and chemical engineering to varying amounts.
Education:
Degrees in mechanical engineering are offered at universities worldwide. In Brazil, Ireland, China, Greece, Turkey, North America, South Asia, and the United Kingdom, mechanical engineering programs typically take four to five years of study and result in a Bachelor of Science (B.Sc), Bachelor of Science Engineering (B.ScEng), Bachelor of Engineering (B.Eng), Bachelor of Technology (B.Tech), or Bachelor of Applied Science (B.A.Sc) degree, in or with emphasis in mechanical engineering. In Spain, Portugal and most of South America, where neither BSc nor BTech programs have been adopted, the formal name for the degree is "Mechanical Engineer", and the course work is based on five or six years of training. In Italy the course work is based on five years of training, but in order to qualify as an Engineer you have to pass a state exam at the end of the course.In Australia, mechanical engineering degrees are awarded as Bachelor of Engineering (Mechanical). The degree takes four years of full time study to achieve. To ensure quality in engineering degrees, the Australian Institution of Engineers accredits engineering degrees awarded by Australian universities. Before the degree can be awarded, the student must complete at least 3 months of on the job work experience in an engineering firm.
In the United States, most undergraduate mechanical engineering programs are accredited by the Accreditation Board for Engineering and Technology (ABET) to ensure similar course requirements and standards among universities. The ABET web site lists 276 accredited mechanical engineering programs as of June 19, 2006.[9] Mechanical engineering programs in Canada are accredited by the Canadian Engineering Accreditation Board (CEAB),[10] and most other countries offering engineering degrees have similar accreditation societies.
Some mechanical engineers go on to pursue a postgraduate degree such as a Master of Engineering, Master of Technology, Master of Science, Master of Engineering Management (MEng.Mgt or MEM), a Doctor of Philosophy in engineering (EngD, PhD) or an engineer's degree. The master's and engineer's degrees may or may not include research. The Doctor of Philosophy includes a significant research component and is often viewed as the entry point to academia.[11] The Engineer's degree exists at a few institutions at an intermediate level between the master's degree and the doctorate.
Coursework
Standards set by each country's accreditation society are intended to provide uniformity in fundamental subject material, promote competence among graduating engineers, and to maintain confidence in the engineering profession as a whole. Engineering programs in the U.S., for example, are required by ABET to show that their students can "work professionally in both thermal and mechanical systems areas."[12] The specific courses required to graduate, however, may differ from program to program. Universities and Institutes of technology will often combine multiple subjects into a single class or split a subject into multiple classes, depending on the faculty available and the university's major area(s) of research.The fundamental subjects of mechanical engineering usually include:
- Statics and dynamics
- Strength of materials and solid mechanics
- Instrumentation and measurement
- Electrotechnology
- Electronics
- Thermodynamics, heat transfer, energy conversion, and HVAC
- Fluid mechanics and fluid dynamics
- Mechanism design (including kinematics and dynamics)
- Manufacturing engineering, technology, or processes
- Hydraulics and pneumatics
- Mathematics - in particular, calculus, differential equations, and linear algebra.
- Engineering design
- Product design
- Mechatronics and control theory
- Material Engineering
- Design engineering, Drafting, computer-aided design (CAD) (including solid modeling), and computer-aided manufacturing (CAM)[13][14]
In addition to the core mechanical engineering curriculum, many mechanical engineering programs offer more specialized programs and classes, such as robotics, transport and logistics, cryogenics, fuel technology, automotive engineering, biomechanics, vibration, optics and others, if a separate department does not exist for these subjects.[15]
Most mechanical engineering programs also require varying amounts of research or community projects to gain practical problem-solving experience. In the United States it is common for mechanical engineering students to complete one or more internships while studying, though this is not typically mandated by the university. Cooperative education is another option.
Salaries and workforce statistics
The total number of engineers employed in the U.S. in 2009 was roughly 1.6 million. Of these, 239,000 were mechanical engineers (14.9%), the second largest discipline by size behind civil (278,000). The total number of mechanical engineering jobs in 2009 was projected to grow 6% over the next decade, with average starting salaries being $58,800 with a bachelor's degree.[19] The median annual income of mechanical engineers in the U.S. workforce was roughly $74,900. This number was highest when working for the government ($86,250), and lowest in education ($63,050).[20]In 2007, Canadian engineers made an average of CAD$29.83 per hour with 4% unemployed. The average for all occupations was $18.07 per hour with 7% unemployed. Twelve percent of these engineers were self-employed, and since 1997 the proportion of female engineers had risen to 6%.
Modern tools

Other CAE programs commonly used by mechanical engineers include product lifecycle management (PLM) tools and analysis tools used to perform complex simulations. Analysis tools may be used to predict product response to expected loads, including fatigue life and manufacturability. These tools include finite element analysis (FEA), computational fluid dynamics (CFD), and computer-aided manufacturing (CAM).
Using CAE programs, a mechanical design team can quickly and cheaply iterate the design process to develop a product that better meets cost, performance, and other constraints. No physical prototype need be created until the design nears completion, allowing hundreds or thousands of designs to be evaluated, instead of a relative few. In addition, CAE analysis programs can model complicated physical phenomena which cannot be solved by hand, such as viscoelasticity, complex contact between mating parts, or non-Newtonian flows
As mechanical engineering begins to merge with other disciplines, as seen in mechatronics, multidisciplinary design optimization (MDO) is being used with other CAE programs to automate and improve the iterative design process. MDO tools wrap around existing CAE processes, allowing product evaluation to continue even after the analyst goes home for the day. They also utilize sophisticated optimization algorithms to more intelligently explore possible designs, often finding better, innovative solutions to difficult multidisciplinary design problems.
SOURCE:http://en.wikipedia.org/wiki/Mechanical_engineering
you may also like: MOST READ
Subscribe to:
Comments (Atom)